
What types of travellers are our followers and what is their travel style?
We can confidently say that the majority of travellers on Share Bus trips are long term ‘backpackers’. Most are also on working holiday visas! Although there are still those on other visas or are young Australians.
However, we wanted to find out some more specific information. So, we polled them on Instagram! Check out how they answered, and see how you compare!
Then we thought, why not? And, also ran a few demographic statistics on people who had registered for a Share Bus trip in the last 12 months (scroll to the bottom half of this blog to see the stats).
Travel style
An active type of traveller? Or more of a chilled type.
Are you the type of traveller who prefers to chill at the beach or hike through a gorge?
The poll we ran on our Instagram found only 21% of travellers said they’d prefer to chill out at a beach. The other 79% said they preferred an active holiday.
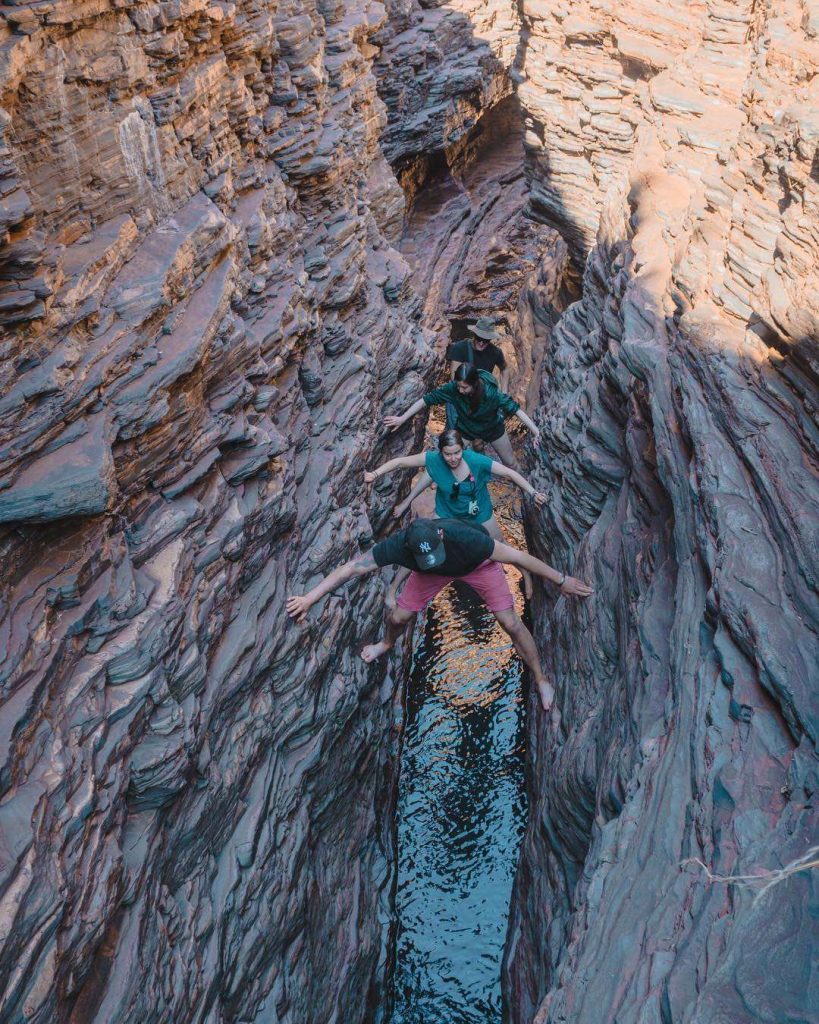
The above picture is of what is known as the “Spider Walk” at Hancock Gorge in Karijini National Park in Western Australia. This is a ‘class 5’ section of the trail that requires you to use your hands and feet to straddle the gap and move along the walls.
Planner vs Spontaneous travel style
No surprises here – backpackers are more spontaneous than most. 66% of respondents said that they preferred a more spontaneous travel style. However, planners are important too – especially when you travel in a group! If you’re looking for a tool to help you plan your camping road trip, we recommend Wikicamps – our favourite travel app.
Free camps or pay camps?
There’s pros and cons to choosing either free camps or pay camps. The biggest pro for free camps is that they are, obviously, free! However, they are also often located far outside cities. This could be a pro or a con depending on the location. Next to some beautiful outback scenery – big pro. Next to the highway? Not so much. They almost always have no shower, and usually have no toilet. So you have to think about whether that suits your travel style.
Now, pay camps. They can be a little bit expensive, especially given you are bringing your own vehicle and equipment to use for cooking and sleeping. The bigger convenience is that you can often stay in town at pay camps. You can also use the facilities to have a hot shower every night.
So what’s the verdict? 75% of followers said they preferred to free camp. How do you compare? Are you the type of traveller who’d prefer to free camp or pay camp?
What locations do these types of travellers prefer?
Then we asked everyone what locations they preferred. East Vs West and North vs South.
East vs West
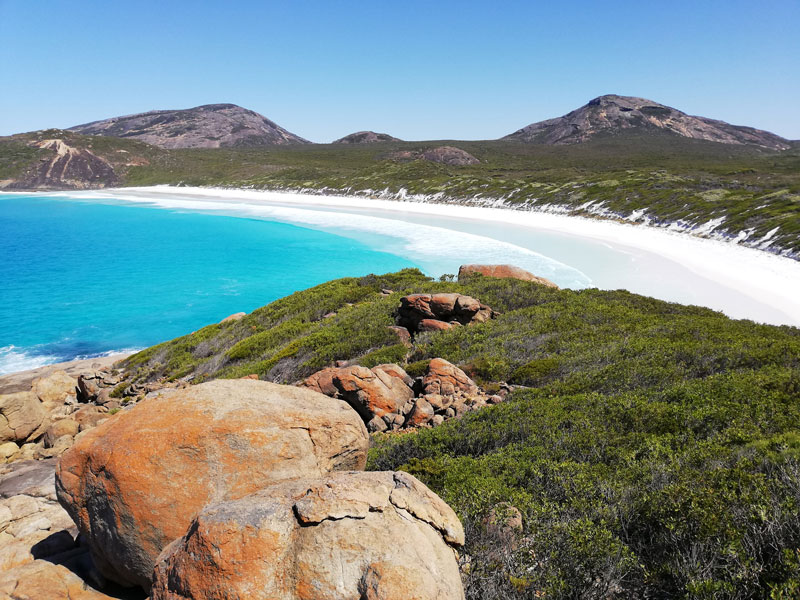
West was the winner of this battle. 66% of respondents said they preferred the west coast.
What’s the difference? The east coast has more infrastructure than the west coast. Travelling time between places is shorter and there are more options about things to do. The west feels wilder, and it’s hard to travel without a car. It also has awesome gorges, and snorkelling, but less greenery than the east coast. Both sides have fantastic beaches but perhaps the beaches in the west are just a little bit better (but at the same time, the water in the ocean is a little bit colder).
We run a few trips on the west coast, the most popular is our Perth to Broome road trip.
North vs South
Up North, you’ll see more red dirt and gorges. In the south, you can find beautiful beaches and greenery. However, as a disclaimer, this is a large generalisation as you can also find some amazing beaches in the North, as well as gorges in the south.
Technically, North was the winner, with 53% of the vote. However, it was so close that I don’t feel I can confidently say there is a difference.
Demographics
Because we were doing this blog post, we decided to also search through our trip registrations to find some interesting statistics about the type of travellers who have registered for one of our trips in the last 12 months.
Traveller Nationality
In the last year, we’ve had people from 38 different countries join one of our trips.
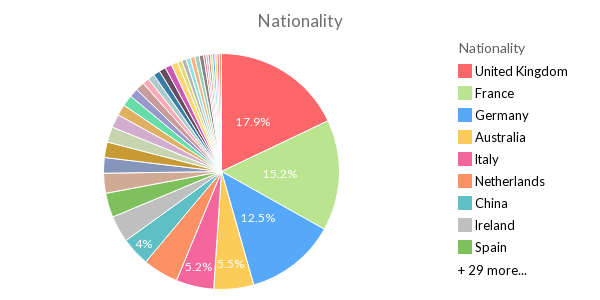
At a glance, you’ll see that there are an easy ‘top 3’ nationalities. These are the UK, France and Germany. However, if you look at the stats you’ll see that the largest group (UK) still only make up 17.9% of registrations (which on a trip of 12 people would be 2 British people on average). That means if you join a trip, you are more than likely going to travel with people from a wide variety of countries. Seems like fun!
Girls vs Boys
We ran the stats on how many guys and girls registered for trips, and this is what we found.

Yep, there are more girls than guys on the trip. Interestingly, it has always been this way since we started Share Bus. So, on a trip of 12 you could expect, on average, 4-5 guys and 7-8 girls.
Age Range
The types of travellers who join our trip are often “working holiday aged”. We always tell people to expect to travel with others from across the whole age range of around 19-33, with an average age of about 25 to 26.
Here are the actual stats from the past year!

It seems like 24-year-olds are overrepresented! We ran the stats and this works out as a total age range of 18-36; an average age of 25.8. Maybe this is the reason for a more active travel style!
Driver vs Non-Driver
For us, sometimes it feels like loads of people are signing up as non-drivers.
However, the stats tell a different story ‘on the whole’.
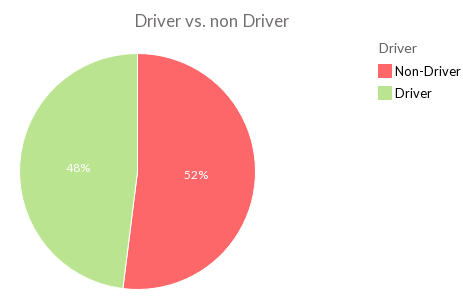
There is almost a 50:50 split of drivers vs. non-drivers on average. That’s not too bad.
So that’s it. Is there anything else you’d like to know about ‘our travellers’?